-
June 23, 2025
Potential Benefits of Investing in Private Real Estate Funds
For accredited investors looking to expand beyond traditional stocks and bonds, private real estate funds have become an increasingly attractive option. These funds have the potential to provide access to professionally managed, income-generating properties, while potentially providing diversification, stability, and tax benefits. At MLG Capital, we’ve spent over 38 years helping investors grow and protect their wealth through private real estate. Below, we explore the key reasons why this asset class has become a cornerstone in many sophisticated portfolios. Why Invest in Private Real Estate Funds Greater Diversification Supports Investment Stability One of the most compelling benefits of private real estate funds is the ability to diversify in ways that individual investors often cannot achieve on their own. MLG Capital’s funds invest across multiple property types and regions throughout the United States. Geographic diversification reduces exposure to localized economic challenges. What’s happening in one city or state does not dictate the performance of the entire portfolio. Meanwhile, asset type diversification (across multifamily, industrial, retail, and office properties) helps balance sector-specific risks. When one asset class softens, another may remain stable or even grow. Enhancing Portfolio Resilience Investing in alternatives like real estate introduces an asset class that has traditionally had…
-
May 21, 2025
Market View 2025: MLG Capital’s Strategic Outlook for Private Real Estate
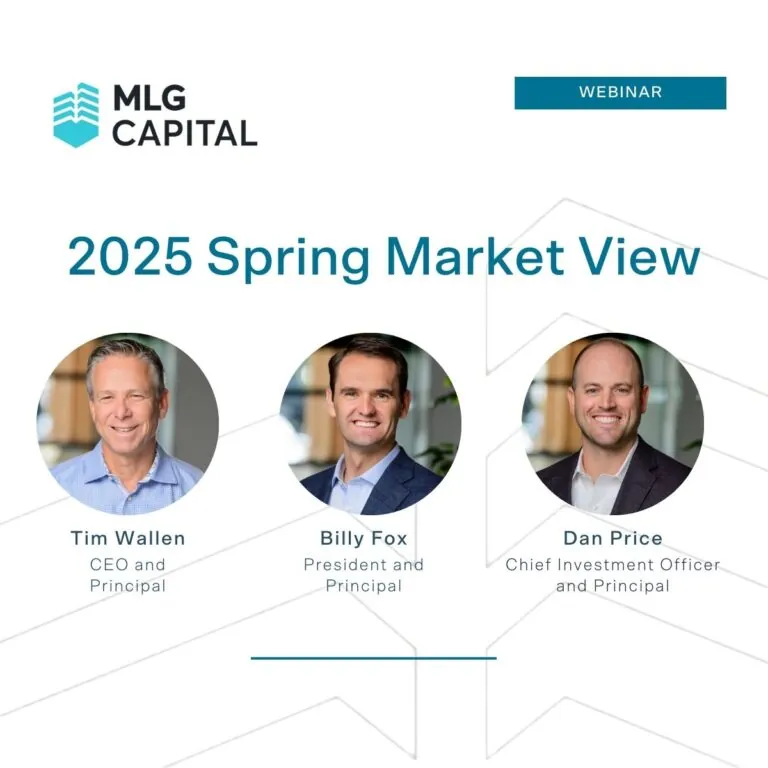
Each year, MLG Capital issues its Market View commentary to offer a clear, data– driven perspective on the state of the private commercial real estate market. In Spring 2025, CEO Tim Wallen, President Billy Fox, and CIO Dan Price convened to discuss market trends and where they see opportunity in the market today. The following highlights from our 2025 Market View discussion explore where we see risk, where we see resilience, and why we are actively deploying capital in the current environment. Key Themes from the Spring 2025 Market View Discussion Soft net operating income (NOI) is creating tactical entry points, not permanent impairments. Operating income across multifamily assets has come under short–term pressure due to record supply deliveries in 2023 and 2024, particularly in high-growth markets such as the Sunbelt. This temporary imbalance has generally reduced occupancies, flattened rent growth, and increased concessions. MLG views this softness not as structural deterioration, but as a cyclical occurrence that is already beginning to normalize in select markets. As operational performance recovers, assets acquired during this window may benefit from meaningful NOI growth over the mid– to long–term. The supply and demand imbalance is correcting and setting the stage for future…
-
April 15, 2025
Navigating 2025 Market Volatility: Why Private Real Estate May Offer Stability for Investors
The public markets are experiencing high volatility—driven by sweeping tariffs, geopolitical uncertainty, and investor anxiety around a potential economic slowdown. In this kind of environment, many high-net-worth investors are re-evaluating their asset allocation strategies. One increasingly popular question: Is it time to move beyond the public markets? While publicly traded REITs (Real Estate Investment Trusts) offer exposure to real estate, they behave more like stocks than the underlying real estate itself. This is because public REITs trade on exchanges and are subject to the same sentiment-driven swings as the broader equity markets. This disconnect highlights the key difference between public REITs and private real estate investments: private real estate is less correlated to public markets. At MLG Capital, we track and compare the performance of public equities, REITs, and private real estate using trusted benchmarks like the S&P 500, the IYR ETF (for public REITs), and the NCREIF Property Index (for institutional private real estate). Historically, and continuing into this volatile 2025 environment, private real estate has shown considerably lower volatility and less correlation with the ups and downs of the stock market. Overexposure to highly correlated, and currently volatile assets, may result in increased risk when compared with a…
-
January 14, 2025
Meet Our Newest Principals
As we begin a new chapter at MLG Capital, we are proud to announce an expanded leadership structure under the continued guidance of CEO Tim Wallen. This change reflects our commitment to fostering long-term growth and ensuring a sustainable future for our company. Effective immediately, we are excited to welcome five outstanding team members as Principals within our organization. Billy Fox: President and Principal Billy Fox, a dedicated member of MLG for the past decade, has been named President and Principal, and will remain a key member of the Investment Committee. In this role, Billy will lead efforts to enhance team building, refine investment strategies, and improve the overall customer experience. Known for his intelligence, empathy, and hard work, Billy exemplifies the qualities of a true leader. His vision and dedication will strengthen MLG’s culture and continue the tradition of providing exceptional service to our clients and investors. Dan Price: Chief Investment Officer and Principal With 16 years in the commercial real estate industry, including four years at MLG, Dan Price has been named Chief Investment Officer and Principal. As CIO, Dan will oversee the development of diversified and attractive real estate funds, bringing his deep industry relationships and market…
-
January 13, 2025
2024 Year in Review
As we close the chapter on 2024, I want to take a moment to reflect on a year defined by purposeful growth, resilience, and the pursuit of excellence. Guided by over 37 years of experience, our team has remained steadfast in our mission: to provide access to a variety of investment opportunities that deliver tax-efficient cash flow and long-term appreciation. Thank you to our investors, deal partners and industry partners for your trust and partnership. To download our 2024 Year-end newsletter, click here or on the image below, and join us in celebrating the collective accomplishments that would not have been possible without your support. Advisory services offered through MLG Fund Manager LLC, an investment adviser registered with U.S. Securities & Exchange Commission.
-
April 30, 2024
How Investors are Paid: MLG’s Private Fund Return Structure
The series of MLG Private Funds provides investors with access to investment opportunities that aim to produce tax-advantaged cash flow and appreciation over time. The Funds focus on growing investors’ wealth, capital preservation and diversification within private real estate investment. Understanding how and when returns are sent to investors is perhaps one of the most important elements of any investment structure. Within the private markets, there are a myriad of different structures that may exist. These structures can be frequently misunderstood. Our Funds utilize a “European equity waterfall return structure”. This is specifically designed to be an investor friendly return structure. This demonstrates our firm’s commitment to investors and our confidence in our ability to execute. MLG Private Funds Return Structure: Each of our private real estate funds utilizes a three-tiered return structure. 100% of available distributions are paid to investors as follows1; (Tier 1) 8% cumulative preferred return on invested equity (Tier 2) 100% return of original principal invested, after a full 8% cumulative preferred return is paid (Tier 3) 70/30 profit sharing split (Investors/MLG) of remaining cash flow distributions after full 8% and 100% return of original principal Subject to available cash flow, each fund makes distributions…
-
April 11, 2023
Understanding the K-1: A Guide for Real Estate Investors
As an investor in a diversified private real estate fund, you have likely come across the term “K-1” and have wondered both what it is and what it means to you. The K-1 is an important tax form that every investor in a partnership, including a real estate investment fund like the series of MLG Private Funds, receives annually, and is a very important document needed for filing your taxes. Let’s break down what a K-1 is, and more importantly, how this document can impact real estate investors personal tax filings. What is a Schedule K-1? A K-1 is a tax form that is used to report a partner’s (investors) share of the income, deductions, credits, and other allocable items of a partnership. It is required to be filed by every partnership (including a real estate investment fund) with the Internal Revenue Service (IRS) and provided to each partner (investor) annually. The K-1 reports the investor’s annual share of the partnership’s taxable income and is used to prepare the investor’s individual tax return What information is included on a K-1? A K-1 form typically includes the following information (see an example 2022 K1 from the IRS): Your tax basis…
Blog
Investing in private real estate across all aspects of the business has put our team in the unique position to allow us to share our industry knowledge. Want to learn more about MLG or real estate? Take a look below.
Subscribe to Our Blog
Scroll Down
Featured Articles
Subscribe to MLG Updates
Join our mailing list to get the latest news and blog updates from MLG!


